
Dynamics 365 usage statistics tell you who’s using your CRM, how often and how deeply.
That’s important because licences are expensive and a system nobody uses is just an expensive address book.
Two Microsoft tools do the work:
- The Power Platform Admin Centre (tenant-wide dashboards covering active users, operations, and entity usage) and
- Dataverse auditing (record-level tracking of creates, reads, updates, and deletes).
To get the full picture
- Connect that data to Power BI for custom dashboards
- Define adoption KPIs before you start measuring
- Manage audit log storage proactively
- Stay within UK GDPR boundaries.
Why you need usage statistics for Dynamics 365
Once your CRM is up and running, you’ll want to know your level of user adoption.
- Are the users using the system as they were trained?
- Who is not using the system so much and can they be helped?
- Are some users beginning to use the system in a more efficient way, who could become internal advocates or trainers for the system?
How does Power Platform Admin Centre compare to Dataverse auditing?
Power Platform Admin Centre and Dataverse auditing solve different problems. Most organisations need both.
| Power Platform Admin Centre | Dataverse Auditing | |
| Setup required | None (available immediately) | Must be enabled per entity |
| Data granularity | Tenant-wide aggregates | Record-level and field-level detail |
| Best for | Adoption trends, active users, licence use | Data governance, compliance, individual record tracking |
| Storage impact | None | Consumes Dataverse database storage |
| Reporting | Built-in dashboards with CSV export | Requires Microsoft Purview or Power BI |
| Historical data | Available from tenant creation | Only from the moment auditing was switched on |
Previously, there was a solution in Microsoft AppSource called Organisation Insights, which has now been discontinued. These two approaches, plus commercial alternatives, are what’s available now.
How do I find active user and licence reports in the Power Platform Admin Centre?
The Power Platform Admin Centre is the quickest way to see Dynamics 365 usage across your organisation. Visit admin.powerplatform.microsoft.com and navigate to Manage > Dataverse.
You’ll find eight report sections:
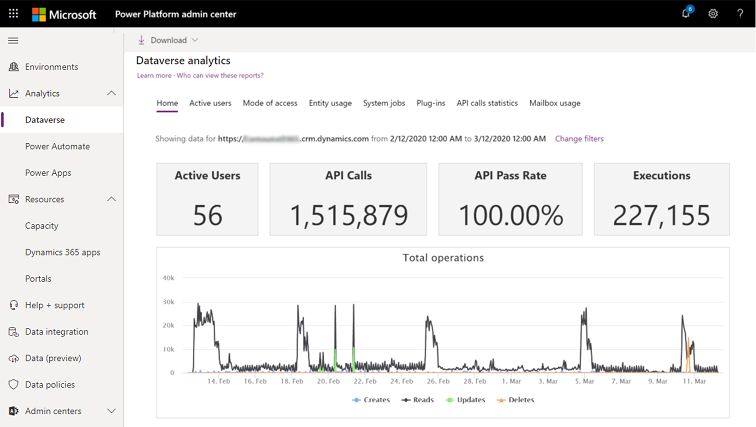
- Home, active user count, total operations (reads, creates, updates, deletes), most active users, plus API and plug-in summaries
- Active Users, most used entities, total page requests, and users performing specific SDK operations (Retrieve, Retrieve Multiple, Create, Update, Delete)
- Mode of Access, breakdowns by operating system, device type, browser, security role, business unit, entity, and client
- Entity Usage, which custom and out-of-the-box (OOB) entities see the most creates, reads, updates, and deletes
- System Jobs, workflow executions, pass rates, throughput per minute, backlog, and the top 10 failing workflows
- Plug-ins, success rates, execution times, and failure rankings
- API Call Statistics, API success rates, call volumes, and top failures
- Mailbox Usage, mailbox types, server configurations, and configuration errors over time
Note: Microsoft often updates the admin portal layout. Menu paths shift, and screenshots in any guide (this one included) can look different from what you see. The data is still there. The navigation just moves around.
What Dynamics 365 user activities can you report on?
In the admin centre, there are 8 reports about Dynamics user activities.
Home
Active users – the number of users who have interacted with your CRM
API calls / Pass Rate, Executions and Top Plug-ins by Failures – these details refer to any plugins you may have installed on your CRM. For a broader overview of CRM usage, you can ignore these
Total Operations – a useful graph. From this you’ll see two important trends – when your CRM is being used and how much it is being used. The graph is split into the various types of operations (read, create, update, delete)
Most Active Users Performing Operations – a graph showing the number of operations per user. Again, operations are broken down by type (read, create, update, delete)
Active Users

Many of these reports expand on the data from the home page dashboard.
New reports include:
- Most Used Entities
- Total Page Requests – The number of page loads of forms, dashboards, or reports.
- Active Users Performing Specific Operations – The number of users over time who performed an operation that caused one of these SDK calls: Retrieve, Retrieve Multiple, Delete, Create, or Update.
- Most Active Users Performing Specific Operations – The number of users who performed an operation that caused one of these SDK calls: Retrieve, Retrieve Multiple, Delete, Create, or Update.
Mode of Access
A series of reports which breaks down users by type, by operation and by device
- Operating System
- Device Type
- Browser
- Security role
- Business Unit
- Entity
- Client(s)
Entity Usage
Useful reports showing exactly which part of Dynamics 365 was used
- Most Used Custom Entities – Which custom entities had the most Creates, Reads, Updates and Deletes.
- Most Used OOB Entities – List of out-of-box entities which had the most Creates, Reads, Updates and Deletes.
- Most Used Entities – a combination of the two reports above to allow comparisons.
System Jobs
Helpful for seeing which workflows are most popular in your organisation, and to troubleshoot
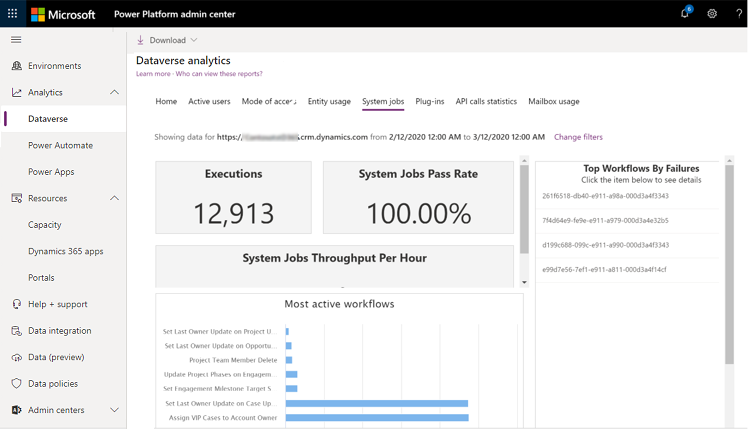
- Workflow Executions
- System Jobs Pass Rate
- System Jobs Throughput/Minute
- Executions and Backlog – the number of executions and the backlog
- Most Active Workflows the top 10 most executed workflows
- Top Workflows by Failures the top 10 most failing workflows. Get more information by clicking on a workflow.
Plug-ins
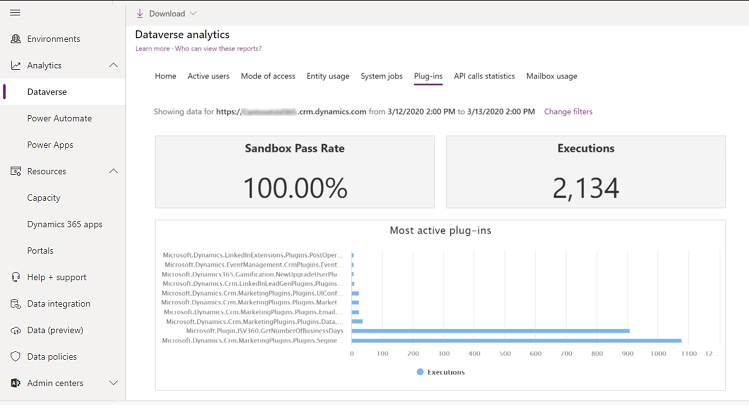
This section shows data about plug-ins
- Plug-in Success Rate
- Plug-in Executions
- Average Plug-in Execution Time
- Most Active Plug-ins
- Top Plug-ins by Failures
API Call Statistics

This section shoes top level, generic information about API calls
- API Success Rate
- Top API by Failures
- Total API Calls
- Most Used API
- API Calls
Mailbox Usage
This section shows details about the types of mailboxes you have and how they are being used
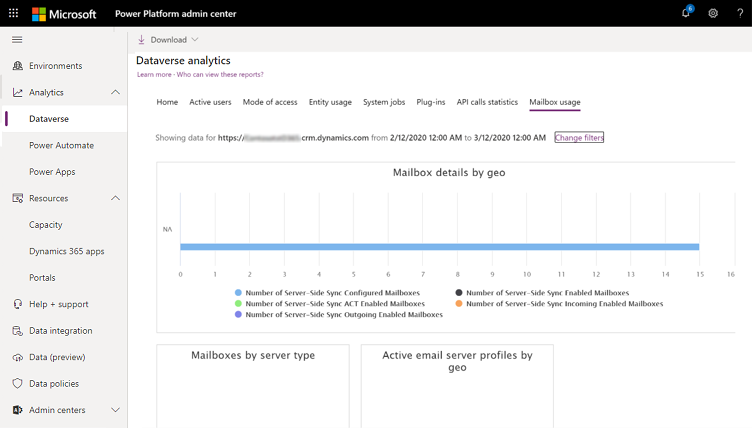
- Mailbox Details by location
- Mailboxes by Server Type
- Active Email Server Profiles by location
- Mailboxes by Exchange Configuration
- Number of Mailbox Configuration Errors- shows the number of mailboxes configuration errors which occurred over the user-selected time frame.
- Mailbox Usage
- Number of Outlook Mailboxes
- Number of Active Email Server Profiles
Downloading reports from Power Platform Admin centre
From the download button at the top of most screens you can download
- Active users by device type
- Active users by business unit
- Active users by security role
- Active users by client
- Active users by entities
- Most active users performing operations
- Most used custom entities List of custom entities
- Most used OOB entities
- Most active workflows
- Most active plug-ins
- Most used API
- Active Dynamics 365 Customer Engagement Plan Users by Application
- Non-conformant usage by users with Team Member license Shows users with team member licenses who are using Dynamics in ways beyond their licence allows
Using Dynamics 365 user auditing to better understand user adoption
User level auditing gives you focused, granular details about user interactions at an entity level
To enable Dynamics 365 user auditing
- In Dynamics 365, enable auditing.
Cog icon > Advanced Settings > Administration > System Settings > Auditing tab. - In Audit settings, check
- Start Auditing
- Audit user access
- Start Read Auditing
- Under Enable Auditing in the following areas, check the areas you wish to audit
- To enable table and field level auditing, go to Settings > Customizations > Customize the System
- Choose Components > Entities and choose an entity to audit.
- In the Data Services section choose check Auditing
- Then, under Auditing, check:
- Single record auditing. Log a record when opened.
- Multiple record auditing. Log all records displayed on an opened page.
- Save > Publish
- Repeat for any other entities you want to audit
- Turn on Microsoft 365 audit logging
- Visit compliance centre https://protection.office.com/
- Go to search > Audit log search
- Click Turn on auditing
Find out more about these steps on Microsoft’s page – Microsoft Dataverse analytics
What data does a Dynamics 365 user audit include?
A Dynamics 365 user audit captures all record actions (create, read, update, delete), record views including grid views and Advanced Find results, Excel exports, third-party app activity, and report views and exports.
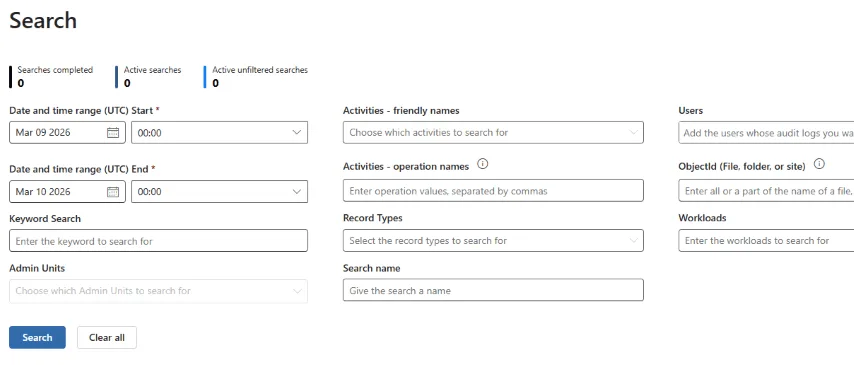
To run reports on this data, visit the Microsoft Purview compliance centre. The output can be massive, so filter by:
- Date
- IP address
- User
- Activity type
- The specific item that was modified
Once you’re happy with the filtered results, export to CSV for analysis in Excel or Power BI.
The raw Dataverse audit data isn’t friendly. Field changes are stored as XML fragments in normalised tables, so building readable reports requires data transformation.
More details on searching the audit log: Search the audit log in the compliance center
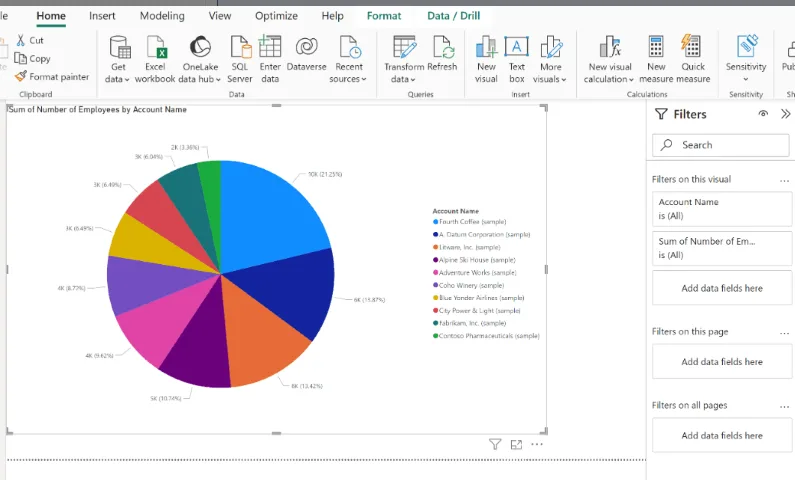
How do I build a Power BI dashboard for Dynamics 365 Sales adoption?
Power BI connects directly to Dataverse using the built-in Dataverse connector or OData feeds. You can query audit log tables, activity tables, and system metadata to build dashboards showing login frequency, record creation rates, and pipeline activity.
Microsoft provides template apps as starting points. They’re worth exploring before you build from scratch.
Be realistic about the skills involved. Building a solid Dynamics 365 usage dashboard in Power BI requires working knowledge of DAX, data modelling, and the Dataverse connector. It’s not a quick drag-and-drop job, especially when you’re transforming those XML audit log fragments into something readable.
There’s a cost consideration too. Sharing interactive Power BI dashboards means recipients need Power BI Pro or Premium Per User licences. For a cost-conscious team, that’s another line on the monthly invoice.
An alternative: export static PDF reports, which doesn’t need additional licences.
See this Microsoft article for more – Create a Power BI report using the Microsoft Dataverse connector – Power Apps | Microsoft Learn
What KPIs should I track to measure Dynamics 365 Sales adoption?
KPIs only work if you define them before you start collecting data. Without agreed targets, monitoring becomes aimless data hoarding.
The metrics that matter for most sales teams:
- Daily/weekly active users, who’s logging in consistently
- Records created or updated, leads, opportunities, quotes
- Activity logging rates, emails, calls, meetings recorded in Dynamics 365
- Pipeline value progression, are opportunities moving through stages?
- Active vs. assigned licence ratio, how many Dynamics 365 licences are actually earning their keep
For manufacturing businesses, correlating CRM activity with order conversion rates is particularly telling. That’s where usage data stops being an IT metric and starts being a board-level conversation.
A login count alone can be misleading. Someone might sign in daily but only glance at a dashboard without updating records or logging activities. Track the depth of engagement, not just the frequency. “Each sales rep logs at least five activities per day and updates opportunity stages weekly” is a clearer benchmark than “everyone logs in.”
Dynamics 365 Sales natively tracks activities (emails, phone calls, appointments, tasks) associated with records. Monitoring the volume and quality of these activities per user or team is a practical, low-effort way to gauge genuine adoption. You can surface this data using system views or Advanced Find queries without any additional tooling.
How do I manage Dynamics 365 audit log storage and retention?
Dataverse auditing consumes database storage, and it adds up quickly. Enabling auditing across multiple entities in a busy environment can push you past your Dataverse storage allocation within months. That means unexpected overuse charges on your Microsoft invoice.
Plan your storage strategy:
- Be selective, audit the entities that matter (Opportunities, Leads, Accounts) rather than everything
- Schedule purges, set up a regular process to delete old Dataverse audit records you no longer need
- Archive externally, move historical audit data to Azure Data Lake or similar storage for long-term retention at lower cost
- Monitor consumption, check your Dataverse storage in the Power Platform Admin Centre regularly
Microsoft 365 audit log data is retained for 90 days by default. With higher-tier licences, that extends to one year, or ten years with an Audit Premium add-on. Dataverse audit logs stay until you manually purge them, which is exactly why storage management matters.
How do I create Power Automate alerts for inactive Dynamics 365 users?
Power Automate can send you a notification when a user stops engaging with Dynamics 365 Sales. Set up a scheduled flow that runs daily or weekly, queries your audit log or a custom usage-tracking Dataverse table, and compares activity against a threshold you define.
If activity drops below your benchmark, the flow sends an email or Microsoft Teams message to the relevant manager. That gives you a chance to follow up with retraining, one-to-one support, or a conversation about what’s getting in the way.
You can also build custom logging where native monitoring falls short. For example, a Power Automate flow triggered on record creation can log usage events to a SharePoint list or custom Dataverse table. That gives you a lightweight telemetry layer without writing code.
Monitoring usage without acting on it is a common trap. Knowing someone hasn’t logged in for three weeks is only useful if there’s a process for you to do something about it.
What are the UK GDPR requirements for monitoring employee CRM usage?
UK GDPR and the Data Protection Act 2018 allow employee monitoring, but you must be transparent about it. The ICO’s Employment Practices Code requires you to inform staff about what you’re monitoring, explain why, and make sure it’s proportionate.
Practical steps:
- Include monitoring details in your staff privacy notice and acceptable use policy
- Conduct a Data Protection Impact Assessment (DPIA) if monitoring is extensive
- Involve your HR team, legal adviser, or Data Protection Officer early. Skipping this step in smaller organisations without dedicated compliance functions is a common failure, and it can lead to staff grievances or ICO enforcement action
- Consider data residency. Azure Application Insights, for example, may default to non-UK data centres. If your internal data governance policies or UK GDPR obligations require data to stay within specific regions, check the Azure region settings before you configure telemetry
Monitoring should be proportionate to the problem you’re solving. Tracking whether sales reps are logging activities is reasonable. Logging every keystroke isn’t. If you’re unsure where the line is, the ICO’s employment practices guidance is a good starting point.
Frequently Asked Questions
Azure Application Insights captures page load times, API call volumes, plug-in execution data, and user session telemetry. It goes deeper than the Power Platform Admin Centre, especially for custom model-driven apps and embedded canvas apps. Setup requires custom instrumentation, so it’s not trivial. But if you’ve extended Dynamics 365 Sales with bespoke components, it’s the best option for tracking usage across those customisations. Standard Admin Centre reports won’t cover them.
Dynamics 365 Sales Professional, Enterprise, and Premium all support the same Power Platform Admin Centre reports and Dataverse auditing. The differences between tiers are about CRM features, not monitoring capabilities. However, audit log retention periods depend on your Microsoft 365 licence tier, not your Dynamics 365 licence. And the Microsoft 365 Admin Centre provides a licence utilisation report (under Reports > Usage) that distinguishes between assigned and active licences. For a team paying per user per month, identifying unused licences can deliver immediate cost savings.
Yes. Solutions like Whatfix, ClickDimensions Analyst, and others on Microsoft AppSource provide pre-built adoption dashboards and analytics that go beyond what Microsoft includes natively. They can save significant time compared to building everything from scratch in Power BI. Microsoft’s own Organisation Insights solution was discontinued, but commercial alternatives have filled the gap. If you’re a lean team without Power BI skills in-house, these are worth evaluating.
Yes. Azure AD (now Entra ID) sign-in logs capture the client application and device type. Azure Application Insights telemetry can also distinguish between the Dynamics 365 mobile app and browser access. That’s useful if you need to understand how field-based sales teams engage compared to office staff.
Microsoft 365 audit log data is kept for 90 days by default, extendable to one year or ten years with higher-tier licences or an Audit Premium add-on. Dataverse audit logs are retained until you delete them, but they consume database storage. See the storage management section above.
Yes. Reporting on security role assignments, team memberships, and business unit structures in Dynamics 365 helps you spot over-provisioned users, potential data leakage risks, and adoption gaps within specific departments. The Mode of Access reports in the Power Platform Admin Centre break down users by security role and business unit. For deeper analysis, query the Dataverse system tables directly through Power BI.
This is where many teams struggle. Login counts and record updates are useful, but they don’t tell the board much on their own. Try correlating CRM activity with order conversion rates, sales cycle length, and forecast accuracy. For example: “Teams that log five or more activities per opportunity convert at 22% versus 11% for teams that don’t.” That’s the kind of number that justifies continued investment.
—